First Analysis
/projects/rev-2-stroke-engine
This project update report discusses the first simulation development ‘phase’ of this project, where actual asymmetric exhaust timing was implemented and results studied. The goal was to determine whether the Rotray Exhaust Valve concept could create a practical fuel-injection window, where the biggest question was…
“Can the exhaust be closed while the transfer flow is still entering the cylinder in a crankcase-scavenged engine?”
My first hypothesis was that it could, but this was quickly challenged during this phase. The most anticipated and largest issue was that the pressure gradient between the cylinder and the crankcase/transfer ports would invert, thereby reversing the scavenging flow. After various attempts to change this effect, it was clear that the pressure gradient could be manipulated to give different results. The simulation bracketed the target metrics, confirming the feasibility on both sides of the performance window, but the optimized middle ground has not yet been found; the tools and processes to do so are being quickly developed.
THE ISSUE
Almost all the simulation runs were examined at 12500RPM which was the peak power range of the reference engine. This obviously isn't going to the peak range anymore since the effects of a tuned pipe are no longer in play; for now, this was ignored.
The initial tests had the REV closing just after BDC, which caused lots of late reverse flow in the transfer passages. This was expected, as the exhaust system is closed and the piston is traveling upward. Not only that, but late transfer flow is negligible since most of the crankcase pressure is released at TPO, meaning by the end of the transfer duration the pressure ratio between the cylinder and the crankcase is low. This leaves another unknown to be discovered; even if transfer port reverse flow is completely fixed, the late flow rate may not be high enough to get enough fuel into the cylinder. For now, the goal is simple
- Prevent all major reverse flow
- Get as much transfer flow rate after REVC as possible.
Changes to the equivalent exhaust valve area and the exhaust pipe (simple megaphone setup) gradually improved power and reduced total reverse scavenging flow. Across the final three early runs, power increased from 19.18 kW to 19.68 kW, while the total reverse-flow fraction fell from 9.5% to 7.2%. A useful way to look at the system is through the transfer-to-cylinder pressure ratio:
When Rp > 1, the pressure gradient supports flow into the cylinder. When Rp < 1, the cylinder pressure is greater and reverse scavenging flow becomes possible.
In the early runs, the transfer flow changed direction around 228–229° ATDC, before the exhaust valve had even completely closed. By the time full closure occurred near 231.5° ATDC, the pressure ratio was already below one. However, after more testing, it is seen that the reverse flow is not directly caused by REVC but can actually be the fault of multiple variables. It was found that I could move where the reverse flow occurs in the cycle. Some tests showed no late flow with lots of early reverse flow, and others showed the opposite. These are caused by the following
Early reverse flow, caused by insufficient blowdown before the transfer ports opened.
Late reverse flow, caused by transfer pressure decaying while cylinder pressure recovered as the exhaust became restricted.


It might be understood that the early reverse flow prevents late reverse flow by delaying the point at which the crankcase pressure rises above the cylinder pressure. This is a sign that optimizing the amount of energy in the crankcase and cylinder is likely to result in a tighter scavenging window. This forces a newer understanding. At first, it was tempting to treat all reverse scavenging flow as a failure. The later studies showed that this is not a useful design target.’
A small amount of early reverse flow may be tolerable if no late reverse flow is occurring. This is actually a behavior that is present in the reference engine, as there is about 1° reverse flow at TPO, which is negligible. Eliminating every trace of it can require delaying transfer opening and closing the transfers so early that the engine loses too much breathing capacity. This became an important criterion to meet.
For comparison, I used the following transfer reverse-flow metric:
The flow integrals used throughout this phase are comparative trace-value-by-crank-degree indices. They are useful for comparing cases, but they have not yet been verified as absolute mass per cycle.
The injection window can be described more simply:
At 12,500 rpm, the real time represented by that window is:
It is important to note that the injection window described refers to the point where the REV is closed and the transfer ports are open. This does not mean the injectors will fire only at this timing. This obviously depends heavily on the duty cycle and engine load; however, it is important to make this injection window as wide as possible for the sake of having more adjustment down the line where specific fuel injection characteristics are simulated. This phase is purely discussing timing characteristics and their potential results.
The injection window is a good metric to follow for REV design, but for this phase I'm using Exhaust Bleed, which is the residual effective exhaust area intentionally retained during the REV closing period to relieve cylinder pressure and preserve forward transfer flow. It is calculated as a percentage after an instantaneous point of the effective area left under the max total exhaust area.
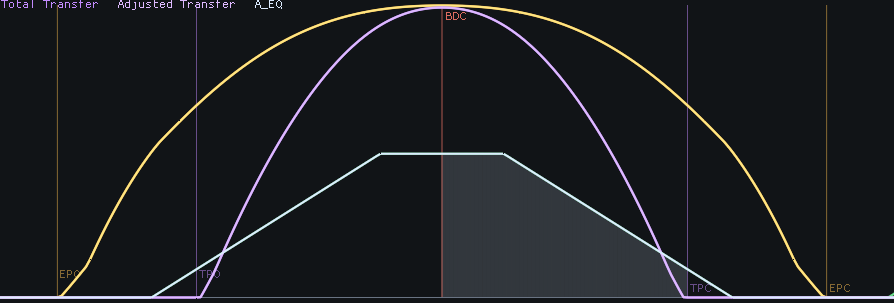
Holding a small exhaust area open after approximately 228° ATDC reduced the late reverse flow. A 10% residual area was near the threshold where late transfer flow began to remain positive, while 15% provided a stronger pressure margin.
This was an important result because it proved that the late reversal was not simply an unavoidable lack of crankcase pressure. If cylinder pressure was managed, the transfer system could continue flowing forward. However, the solution conflicted with the design intent. More exhaust bleed also meant more exhaust flow during the intended injection window. The 15% case produced the best transfer direction, but it also created the greatest risk of allowing injected fuel to escape.
This determined some useful limits and created a tool for future design but is not the solution to the problem. It did suggest that a tapered closure timing curve may eventually be useful, but not enough to close the gap.
Crankcase Pressure Study
This was a very interesting metric to adjust as it had a lot of effect on the shape of the flow curves. Increasing crankcase compression ratio improved total delivery, charging efficiency, and peak power. The 1.30 CCR case reached 22.28 kW, making it the strongest case in that sweep by conventional performance metrics. However, it was also a poor case for the injection objective.
As CCR increased, transfer delivery became more heavily front-loaded. The cylinder filled more strongly earlier in the cycle, but transfer pressure fell away sooner, and the late pressure gradient became worse. In the 1.30 case, useful positive transfer flow after 228° was almost gone even though the total power was higher. For each future change, finding an optimized CCR is to be prioritized
Shortening transfer timing
This was a quick study to see the effect of the changes. Moving transfer opening later also moved transfer closure earlier. This sharply reduced reverse flow, but largely because the transfer ports closed before the adverse pressure gradient had enough time to act.
The diagnostic cases around 128–130° transfer opening reduced the reverse fraction to roughly 0.7–1.3%, but peak power fell drastically. The remaining late transfer window also collapsed to only a few crank degrees. This proved that transfer timing is a very strong lever but resulted in a choked engine.
Optmiztation Study
I eventually got to a point where I felt as though I knew enough about the exhaust behavior to begin some super simple optimization runs. This provided the clearest pattern of the entire phase. All numbered cases used effective exhaust timing of approximately 88/226° ATDC, meaning that the exhaust path was closed before the late transfer period. The main variables were transfer timing and delivery level.
The results showed a consistent tradeoff:
- long 121/239° transfer timing provided more duration but produced excessive post-closure reverse flow;
- 128/232° timing minimized reverse flow but left only a 6° injection window;
- 124/236° and 126/234° formed the most useful middle region.
| Candidate | Transfer timing | Power | Reverse fraction | EVC-to-TPC window | Main tradeoff |
|---|---|---|---|---|---|
| QT_7 | 124/236° | 22.68 kW | 2.97% | 10° | More injection time, more late reverse |
| QT_9 | 126/234° | 23.70 kW | 1.63% | 8° | Best current balance if injector duration is feasible |
| QT_10 | 128/232° | 23.37 kW | 0.55% | 6° | Lowest reverse, shortest practical window |
QT_9 is currently the most promising baseline. It retained strong output and significantly reduced reverse flow without shortening the injection window as severely as QT_10.
The concept has therefore moved beyond the original question of whether the exhaust can be closed before transfer closure. The new question is: How much transfer duration is required after exhaust closure, and how much reverse flow can be tolerated while still delivering and trapping the required fuel?
Newly Understood Limitations
The REV cycle has less time to move the same mass. It closes the exhaust earlier, shortens the useful transfer period, and adds another flow restriction downstream of the piston-controlled exhaust port. The current limitation is therefore no longer simply reverse flow. It is the ability to recover transfer and exhaust flow capacity without reopening the direct short-circuit path or recreating late transfer reversal. This may require some combination of:
- greater transfer-port or duct area at fixed timing;
- greater effective exhaust area before valve closure;
- better pressure delivery through the transfer ducts;
- exhaust-pipe tuning around the new EVC;
- or operation at a lower engine speed where the available crank-angle windows represent more real time.
That last point is important. At the end of the study, I did a normal performance test simulation and compared it to the reference engine. The graph is very surprising…
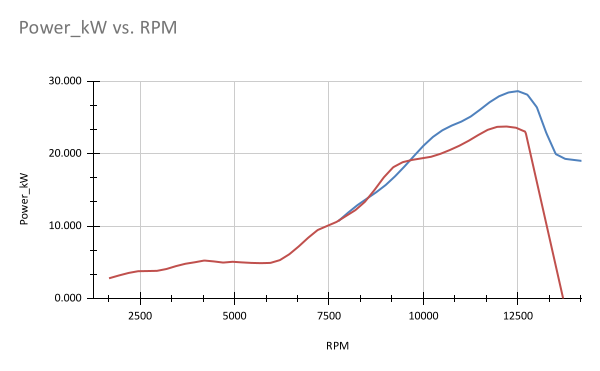
As seen the new REV has much more low end than the compared reference engine although it has a lower peak power. This is interesting and re-enforces the fact that the peak power point has likely changed and the simulation program may be over correcting. This is something that will be studied more in the next phase.